| advertisement: compare things at compare-stuff.com! |
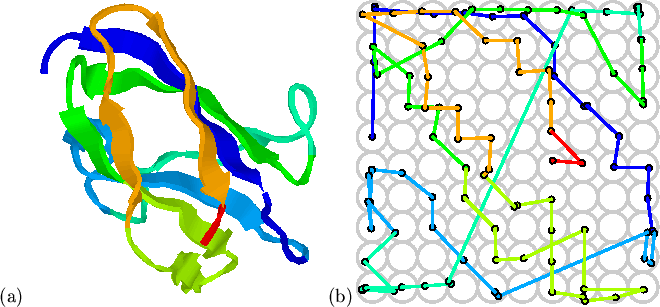
Figure 5.2 shows results of the mapping of the 107
carbon-![]() coordinates of domain 4 of cyclodextrin
glycosyltransferase[Klein & Schulz, 1991, PDB entry 1cgt, CATH entry 1cgt04]. The
largely non-overlapping chain trace through the map
(Figure 5.2(b)) retains the ordering of most of the strands
in this immunoglobulin-like fold. The two halves of the
coordinates of domain 4 of cyclodextrin
glycosyltransferase[Klein & Schulz, 1991, PDB entry 1cgt, CATH entry 1cgt04]. The
largely non-overlapping chain trace through the map
(Figure 5.2(b)) retains the ordering of most of the strands
in this immunoglobulin-like fold. The two halves of the ![]() -sandwich
occupy separate parts of the map. One major discontinuity (in green)
occurs between residues 43 and 44 (sequential numbering starting from 1)
where the chain crosses from one sheet to the other, and local distance
constraints cannot be maintained.
-sandwich
occupy separate parts of the map. One major discontinuity (in green)
occurs between residues 43 and 44 (sequential numbering starting from 1)
where the chain crosses from one sheet to the other, and local distance
constraints cannot be maintained.
 |
 |
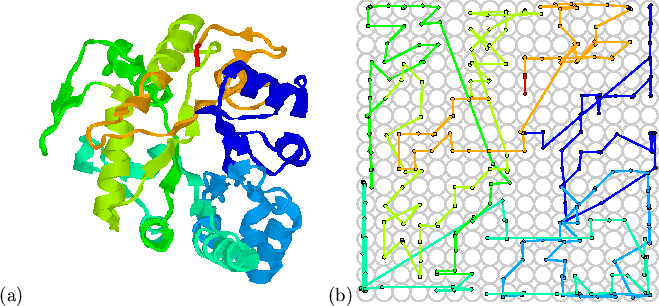
Figure 5.3 shows the mapping of a larger protein domain;
1ghsA0[Varghese et al.,
1994] from the CATH database; this 1,3-![]() -glucanase is a
TIM-barrel domain[Farber, 1993,Orengo et al.,
1994,Reardon & Farber, 1995] consisting
of an 8-fold repeat of a basic
-glucanase is a
TIM-barrel domain[Farber, 1993,Orengo et al.,
1994,Reardon & Farber, 1995] consisting
of an 8-fold repeat of a basic
![]() super-secondary motif. As
in Figure 5.2, the major relationships have been preserved:
the central
super-secondary motif. As
in Figure 5.2, the major relationships have been preserved:
the central ![]() -barrel and the arrangement of the surrounding helices.
The mapping is more complex than the previous immunoglobulin-like example,
and the preservation of important contacts is not obvious without detailed
inspection.
-barrel and the arrangement of the surrounding helices.
The mapping is more complex than the previous immunoglobulin-like example,
and the preservation of important contacts is not obvious without detailed
inspection.
The intramolecular distance matrix[Phillips, 1970] is a representation of
protein structure which allows all contacts to be visualised
simultaneously. The top half of Figure 5.4 shows a
Euclidean distance matrix, calculated from the input data (carbon-![]() coordinates). The amino-terminus of the sequence is located at the bottom
left corner. White regions indicate residue pairs in close contact (the
grey-scale is normalised to white=closest distance, black=furthest
distance). The bottom half shows the Euclidean distances for the same
residue pairs calculated from the map coordinates (hence the distance
between residue A mapping to
coordinates). The amino-terminus of the sequence is located at the bottom
left corner. White regions indicate residue pairs in close contact (the
grey-scale is normalised to white=closest distance, black=furthest
distance). The bottom half shows the Euclidean distances for the same
residue pairs calculated from the map coordinates (hence the distance
between residue A mapping to ![]() and residue B mapping to
and residue B mapping to ![]() would be
would be
![]() ). The two matrices share the same major
features: the clear pattern of parallel
). The two matrices share the same major
features: the clear pattern of parallel ![]() -strands and helices in the
first third of the sequence in particular. The correlation coefficient
between the real distances and the map distances is 0.85.
-strands and helices in the
first third of the sequence in particular. The correlation coefficient
between the real distances and the map distances is 0.85.