


Next: Antibody-antigen interface
Up: Results
Previous: CDR backbone conformation
Contents
Antibody surface topography
To analyse patterns of surface topography, a fractal measure was used to
identify the gross surface shapes which have, until now, been classified by
eye: i.e. cavity, groove and planar[Webster et al.,
1994]. The method
reduces a three-dimensional molecular surface patch (of any size) to a
two-dimensional composition profile which quantifies the relative amounts
of concavity and convexity, and uses the fractal atomic density
measure of Kuhn et al.kuhn:fractals to quantify local
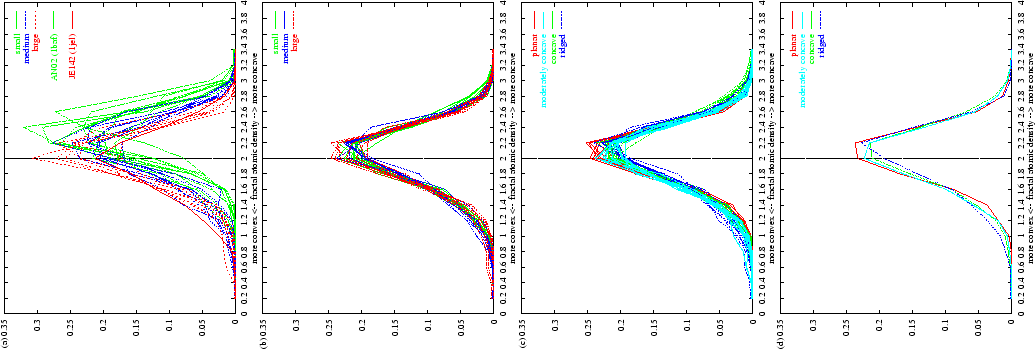
surface curvature. In Figure 2.6(a), the surface
convexity/concavity composition profiles are shown for antibody-antigen
interface surfaces; Figures 2.6(b) to (d) show the same
profiles for the whole combining site surfaces (using our `contact' CDR
definition, see Table 2.3).
Figure 2.6:
Convexity/concavity composition profiles for antibody molecular
surfaces. (a) Profiles for the 26 antibody-antigen interface
surfaces. Data are grouped into antigen/interface size class (see
Table 2.1 and Methods). Small antigens have
more concave binding pockets whilst larger antigens have flatter binding
surfaces (more points with fractal atomic density  ).
(b) Profiles for the whole combining site surfaces (defined as the
surface overlying `contact defined' CDR residues -- see text) for the 26
complexes (colours are as in (a)). (c) After clustering: whole
combining site surfaces (see (b)) for all 45 complexed and uncomplexed
antibodies. Line colours and descriptions refer to the four clusters
determined for these data (see text). (d) Near-median
representatives of each cluster in (c).
).
(b) Profiles for the whole combining site surfaces (defined as the
surface overlying `contact defined' CDR residues -- see text) for the 26
complexes (colours are as in (a)). (c) After clustering: whole
combining site surfaces (see (b)) for all 45 complexed and uncomplexed
antibodies. Line colours and descriptions refer to the four clusters
determined for these data (see text). (d) Near-median
representatives of each cluster in (c).
 |
Subsections
Next: Antibody-antigen interface
Up: Results
Previous: CDR backbone conformation
Contents
Copyright Bob MacCallum
- DISCLAIMER: this was written in 1997 and may contain out-of-date information.