| advertisement: compare things at compare-stuff.com! |
The secondary structure prediction program DSC[King & Sternberg, 1996, also see
Section 1.4.4] was used to generate
probabilities for the helix and strand secondary structural states for each
residue in a domain sequence using as input its associated multiple
sequence alignment. Therefore the property vector, ![]() , has two
components. The DSC method is approximately 70% accurate using the
, has two
components. The DSC method is approximately 70% accurate using the ![]() measure, as tested in blind trials at CASP2. We make the assumption that
the DSC algorithm does not significantly memorise the secondary structural
states of residues in its learning set of protein structures (many of which
will have homologues in our dataset). Our reason is that it has far fewer
parameters than the PHD method (DSC:1000, PHD:25,000) compared with the
number of residues in the training set (23,000). Furthermore, when tested
without jack-knifing on its training set of 126 proteins,
measure, as tested in blind trials at CASP2. We make the assumption that
the DSC algorithm does not significantly memorise the secondary structural
states of residues in its learning set of protein structures (many of which
will have homologues in our dataset). Our reason is that it has far fewer
parameters than the PHD method (DSC:1000, PHD:25,000) compared with the
number of residues in the training set (23,000). Furthermore, when tested
without jack-knifing on its training set of 126 proteins, ![]() increases by
only a few percent (R. King, personal communication).
increases by
only a few percent (R. King, personal communication).
The results for fold recognition using alignments of two component vectors
of helix and strand probabilities are quite interesting
(Table 4.4). The number of correct top-ranking predictions is
not special (![]() ), but the mean adjusted rank is the best so far
(
), but the mean adjusted rank is the best so far
(
![]() ). The alignment quality is, however, the worst so
far (
). The alignment quality is, however, the worst so
far (
![]() ). It seems likely that the improved average
ranking is the result of non-specific recognition of domains with similar
predicted secondary structure content. The poor alignments are probably
due to the lack of phase information in the secondary structure
predictions, compared with the hydrophobicity information which, as already
discussed, is frequently alternating in magnitude.
). It seems likely that the improved average
ranking is the result of non-specific recognition of domains with similar
predicted secondary structure content. The poor alignments are probably
due to the lack of phase information in the secondary structure
predictions, compared with the hydrophobicity information which, as already
discussed, is frequently alternating in magnitude.
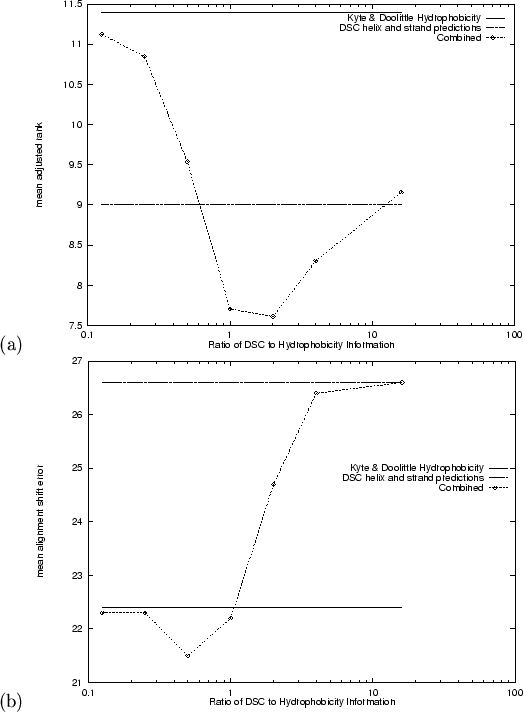
As with the alignment of sequence conservation information, we found that
the combination of hydrophobicity with predicted secondary structure
information was cooperative (![]() is now a three component vector).
Figure 4.2 shows the effect of the ratio between the two
components. The minima for
is now a three component vector).
Figure 4.2 shows the effect of the ratio between the two
components. The minima for
![]() and
and ![]() are
found, surprisingly, at different ratios: 2:1 and 1:2 respectively
(hydrophobicity:secondary structure prediction), both giving better
performance than either measure alone. The numerical results for these
combinations and the intervening ratio of 1:1 are given in
Tables 4.4 and 4.9.
are
found, surprisingly, at different ratios: 2:1 and 1:2 respectively
(hydrophobicity:secondary structure prediction), both giving better
performance than either measure alone. The numerical results for these
combinations and the intervening ratio of 1:1 are given in
Tables 4.4 and 4.9.
 |
The low
![]() results for ratios 1:1 and 1:2 may be in part
due to the improved recognition of Ig-like topologies (2.60.40). There are
results for ratios 1:1 and 1:2 may be in part
due to the improved recognition of Ig-like topologies (2.60.40). There are
![]() correct top ranking predictions with a ratio of 1:1, almost twice
as many as the basic Smith Waterman method.
correct top ranking predictions with a ratio of 1:1, almost twice
as many as the basic Smith Waterman method.