| advertisement: compare things at compare-stuff.com! |
The measure of sequence conservation, ![]() , adopted for this work, is
adapted from Taylortaylor:mst. For residue
, adopted for this work, is
adapted from Taylortaylor:mst. For residue ![]() in a multiple
sequence alignment,
in a multiple
sequence alignment, ![]() is defined as follows:
is defined as follows:
Overall fold recognition results are poor using only sequence conservation
information (Table 4.4). This might be expected since
sequence conservation is the secondary consequence of the structural and
functional characteristics of proteins. One interesting outcome, however,
is that the second highest Z-score, correctly identifies library domain
1hcnB0 for query domain 2tgi00 (one of only two correct top hits, data not
shown). This (2.10.90) topology contains the cysteine knot motif, a
cluster of disulphide bonds connecting ![]() -strands.
Cysteines making such bonds are known to be
well conserved, and in this fold, the pattern of conservation appears to
be clear enough for recognition purposes.
-strands.
Cysteines making such bonds are known to be
well conserved, and in this fold, the pattern of conservation appears to
be clear enough for recognition purposes.
Combinations of conservation and hydrophobicity give understandably better
results; it is the conserved hydrophobic residues that are expected to be
in the core of protein folds (but also in the active sites of some), and
amphipathic patterns of hydrophobicity ought to be conserved in core
secondary structure elements. A measure of conserved
hydrophobicity, after Taylortaylor:mst, can be calculated as
follows:
The fold recognition results using conserved hydrophobicity, given in
Tables 4.4 and 4.8, are the best so far in
terms of ![]() , and
, and
![]() is also good. Remarkably, 8 out
of the top 9 ranking predictions (Table 4.8) from this
trial are correct, at rank number one on a per-query basis. Using this
small fold library and a Z-score threshold of 1.0, the alignment of
conserved hydrophobicity could give 80-90% correct first hits above the
threshold, with a coverage of about 30% (the chance of getting a result
above the threshold; see Section 4.4.4 for more discussion).
is also good. Remarkably, 8 out
of the top 9 ranking predictions (Table 4.8) from this
trial are correct, at rank number one on a per-query basis. Using this
small fold library and a Z-score threshold of 1.0, the alignment of
conserved hydrophobicity could give 80-90% correct first hits above the
threshold, with a coverage of about 30% (the chance of getting a result
above the threshold; see Section 4.4.4 for more discussion).
With similar goals in mind, sequences encoded by a two-component vector
![]() , of hydrophobicity (
, of hydrophobicity (![]() ) and sequence conservation (
) and sequence conservation (![]() ),
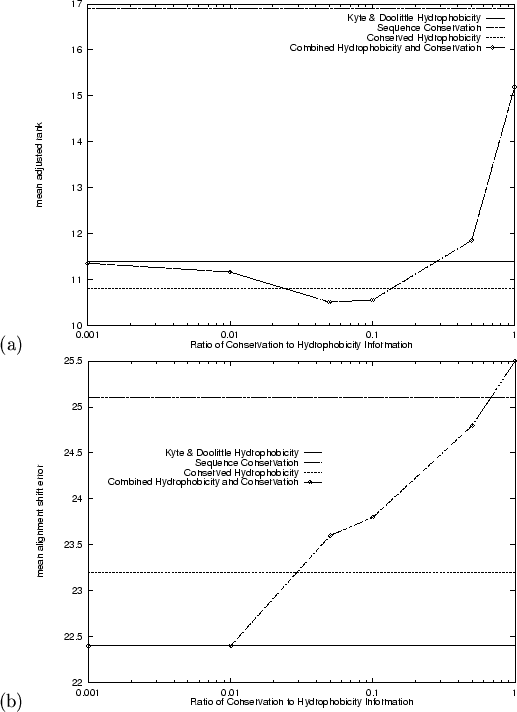
were also aligned. Figure 4.1 shows the results for mean
adjusted rank and mean alignment error using a range of different
weightings for the sequence conservation component vs. the
hydrophobicity component. Mean adjusted rank results were better than
those from either of the two measures alone or the conserved hydrophobicity
measure, when the ratio of hydrophobicity to conservation was 20:1 or 10:1.
A further improvement in the number of top ranking correct folds (
),
were also aligned. Figure 4.1 shows the results for mean
adjusted rank and mean alignment error using a range of different
weightings for the sequence conservation component vs. the
hydrophobicity component. Mean adjusted rank results were better than
those from either of the two measures alone or the conserved hydrophobicity
measure, when the ratio of hydrophobicity to conservation was 20:1 or 10:1.
A further improvement in the number of top ranking correct folds (![]() )
is seen with both these ratios. Alignment quality did not improve, however,
beyond that already obtained using hydrophobicity alone
(Figure 4.1(b)).
)
is seen with both these ratios. Alignment quality did not improve, however,
beyond that already obtained using hydrophobicity alone
(Figure 4.1(b)).
 |