| advertisement: compare things at compare-stuff.com! |
In order to estimate the reliability of fold recognition, one must first
assume that null predictions can be confidently made. Accuracy measures
(for example ![]() ) can only be used to estimate the probability of a correct
recognition given that one can be made. For the large trial of 78
queries against 197 library domains the probability of a correct top
prediction is 45% (18% are detected by single sequence methods). It has
already been mentioned that the Z-score (alignment score normalised by the
mean and standard deviation of the the 197 query-library alignment scores)
can be taken as an estimate of the significance of a sequence-structure
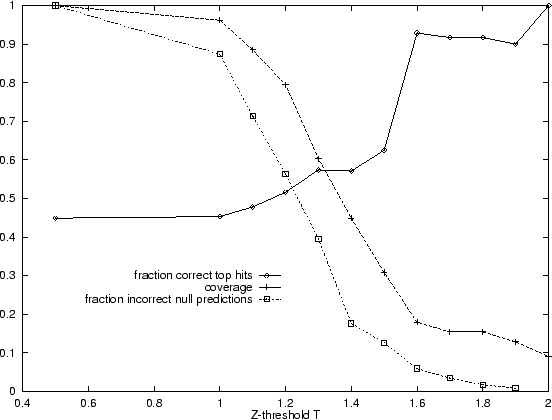
pairing. Figure 4.3 shows how a Z-score threshold or filter
affects the accuracy (fraction of correct top hits above threshold) and
coverage (fraction of queries with top hits above threshold). From this
analysis it is clear that the Z-score does allow some discrimination
between strong and weak predictions. The accuracy is around 90% for the
18% of queries, producing a top ranking alignment with a Z-score greater
than 1.6 (
) can only be used to estimate the probability of a correct
recognition given that one can be made. For the large trial of 78
queries against 197 library domains the probability of a correct top
prediction is 45% (18% are detected by single sequence methods). It has
already been mentioned that the Z-score (alignment score normalised by the
mean and standard deviation of the the 197 query-library alignment scores)
can be taken as an estimate of the significance of a sequence-structure
pairing. Figure 4.3 shows how a Z-score threshold or filter
affects the accuracy (fraction of correct top hits above threshold) and
coverage (fraction of queries with top hits above threshold). From this
analysis it is clear that the Z-score does allow some discrimination
between strong and weak predictions. The accuracy is around 90% for the
18% of queries, producing a top ranking alignment with a Z-score greater
than 1.6 (![]() ). These are equivalent to, but not identical to, the
easy targets which were correctly identified by the Smith Waterman method.
More interesting is the rise in accuracy between Z-thresholds of 1.0 and
1.3 of 45% to 57%. This is not a side-effect of the 14 confident
predictions with
). These are equivalent to, but not identical to, the
easy targets which were correctly identified by the Smith Waterman method.
More interesting is the rise in accuracy between Z-thresholds of 1.0 and
1.3 of 45% to 57%. This is not a side-effect of the 14 confident
predictions with ![]() , since when these are excluded the accuracy rises
from 34% to 41% (14 out of 34 correct).
, since when these are excluded the accuracy rises
from 34% to 41% (14 out of 34 correct).
Of the top ranking alignments with ![]() , only 7 out of 22 (32%) are
correct. Hand checking the top ranking, but incorrect (according to CATH),
alignments with high Z-scores identified a further 7 pairs (in
Table 4.10) of domains whose SSAP alignment looked
meaningful. In the latest version of CATH, many of these have been
corrected. Thus when
, only 7 out of 22 (32%) are
correct. Hand checking the top ranking, but incorrect (according to CATH),
alignments with high Z-scores identified a further 7 pairs (in
Table 4.10) of domains whose SSAP alignment looked
meaningful. In the latest version of CATH, many of these have been
corrected. Thus when ![]() , 13 out of 22 (59%) are correct by these
criteria; the coverage is 34% (a total of 65 predictions with top ranking
Z-score
, 13 out of 22 (59%) are correct by these
criteria; the coverage is 34% (a total of 65 predictions with top ranking
Z-score ![]() )
)![]() .
.
 |
| query | library | |||
| domain | topology | domain | topology | Z-score |
| 1atnA2 | 3.30.420 | 1atr01 | 3.40.40 | 1.997 |
| 1rcb00 | 1.20.160 | 1rfbA0 | 1.10.430 | 1.594 |
| 1scuA1 | 3.40.330 | 1atr01 | 3.40.40 | 1.544 |
| 3ecaA2 | 3.40.320 | 1ntr00 | 3.40.330 | 1.518 |
| 1ovb00 | 3.40.190 | 2ohxA2 | 3.40.330 | 1.502 |
| 2hmqA0 | 1.20.120 | 1rcb00 | 1.20.160 | 1.440 |
| 3inkC0 | 1.20.160 | 1glqA2 | 1.10.270 | 1.424 |
Better methods of assessing the significance of alignments and alignment
scores[Bryant & Altschul, 1995,Henikoff, 1996] could be employed. By performing
![]() alignments with shuffled query and/or library sequences one can at best
calculate P-scores (probability that the true alignment score is better
than random) of
alignments with shuffled query and/or library sequences one can at best
calculate P-scores (probability that the true alignment score is better
than random) of ![]() . Ranking by P-score[Bryant & Altschul, 1995] rather than
our Z-score may improve the number of top hits and simultaneously provide
better confidence estimates.
. Ranking by P-score[Bryant & Altschul, 1995] rather than
our Z-score may improve the number of top hits and simultaneously provide
better confidence estimates.