| advertisement: compare things at compare-stuff.com! |
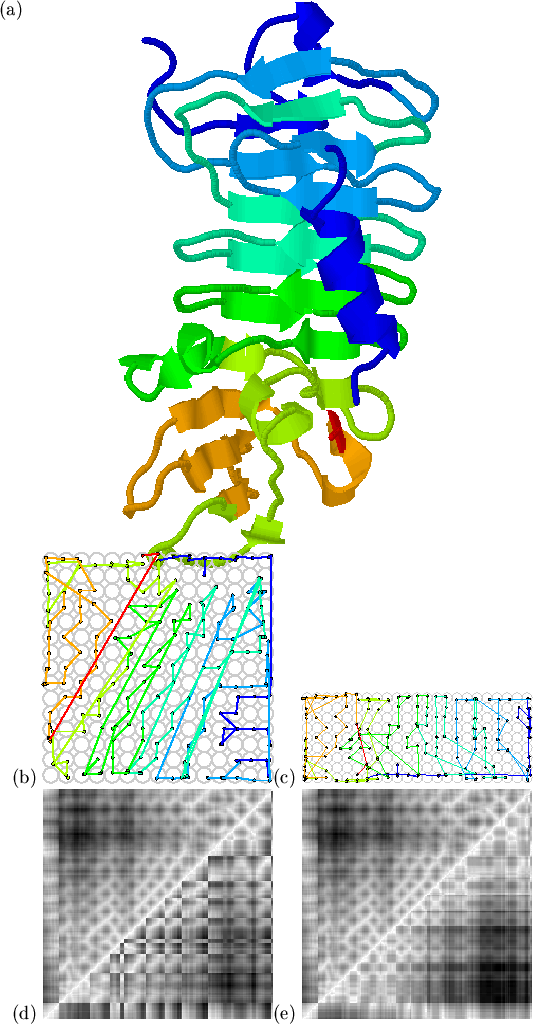
For the mapping in Figures 5.3 we have used a ![]() map grid to accommodate the 306 residues, on the assumption that the
number of map nodes should be proportional to the volume of domain, which
is in turn proportional to the number of residues in the
domain[Hao et al., 1992]. Through experimentation, a scaling factor of 1.0
(i.e. 100 residues
map grid to accommodate the 306 residues, on the assumption that the
number of map nodes should be proportional to the volume of domain, which
is in turn proportional to the number of residues in the
domain[Hao et al., 1992]. Through experimentation, a scaling factor of 1.0
(i.e. 100 residues
![]() map) was found to give
sensible maps.
map) was found to give
sensible maps.
Self-organising maps need not be square. In fact, the dimensions of the
map should reflect the distribution of input vectors; if the input vectors
occupy a long and thin region of space, then mapping to a long and thin grid
will give the best performance. With high-dimensional inputs, the first
two principal components give an approximation of the length and breadth of
the input space. We therefore use the ellipsoid approximations of the
atomic coordinates of each domain[Taylor et al.,
1983] to specify the
ratio of ![]() to
to ![]() . Three eigenvalues are obtained from the principal
components analysis of atomic coordinates. In order of descending
magnitude they represent the lengths of the long, middle and short axes of
the best fitting ellipsoid and are defined as
. Three eigenvalues are obtained from the principal
components analysis of atomic coordinates. In order of descending
magnitude they represent the lengths of the long, middle and short axes of
the best fitting ellipsoid and are defined as ![]() ,
, ![]() , and
, and ![]() respectively. The number of residues in the domain is
respectively. The number of residues in the domain is ![]() . The map
dimensions
. The map
dimensions ![]() and
and ![]() must satisfy the following equations:
must satisfy the following equations:
| (13) |
| (14) |
 |