Alignment quality for
| advertisement: compare things at compare-stuff.com! |
It was noted that the mean alignment shift for the 56 non-self comparisons
between the 8 ![]() doubly wound (3.40.330) folds in the dataset,
using mapped hydrophobicity, were particularly good (data not shown).
Could these folds be more suitable for the mapping approach? 50 replicates of
each of the 56 alignments were performed in order to discover if the
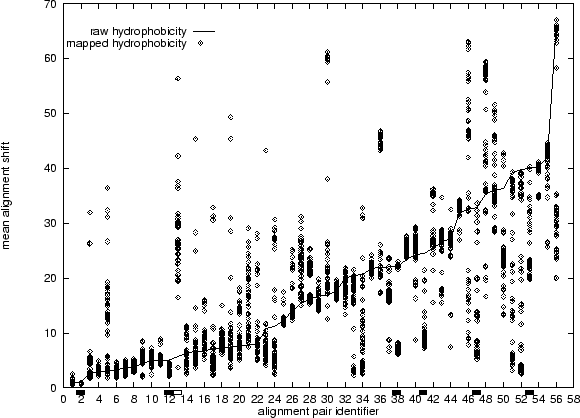
improved alignment quality was consistent. Figure 5.13 shows
the results. The solid line shows the alignment shift for the unmapped
alignments, whilst each of the points marks the shift for a replicate of the
mapped alignment. The points have a fairly clumpy distribution in many
cases. In some cases the clumps are below the line, indicating better
alignments from the mapping, and in other cases they are above, indicating
worse alignments. The improved average alignment quality we initially
observed suggests that there are more improvements than deteriorations.
doubly wound (3.40.330) folds in the dataset,
using mapped hydrophobicity, were particularly good (data not shown).
Could these folds be more suitable for the mapping approach? 50 replicates of
each of the 56 alignments were performed in order to discover if the
improved alignment quality was consistent. Figure 5.13 shows
the results. The solid line shows the alignment shift for the unmapped
alignments, whilst each of the points marks the shift for a replicate of the
mapped alignment. The points have a fairly clumpy distribution in many
cases. In some cases the clumps are below the line, indicating better
alignments from the mapping, and in other cases they are above, indicating
worse alignments. The improved average alignment quality we initially
observed suggests that there are more improvements than deteriorations.
 |
In order to test the significance of the results, consider a pair of
domains A and B. Suppose we know accurately the mean, ![]() , of the
alignment shifts for A vs. B using unmapped sequences. We could then
ask if the observed mean shift,
, of the
alignment shifts for A vs. B using unmapped sequences. We could then
ask if the observed mean shift, ![]() , for the sample of 50
alignments of A vs. B was significantly different from
, for the sample of 50
alignments of A vs. B was significantly different from ![]() using
standard tests which assume a normal distribution. However, as discussed
above, we do not have an accurate estimate for
using
standard tests which assume a normal distribution. However, as discussed
above, we do not have an accurate estimate for ![]() because we cannot
repeat the results with unmapped data. Hence the test cannot be performed.
Instead, we can only ask if the single observation of the alignment shift
for unmapped sequences A and B is likely to be part of the distribution of
alignment shifts for the mapping replicates. Assuming a normal
distribution of mapped results for each pair of domains
(Figure 5.13 shows that this assumption is wrong in many
cases), we calculate for the unmapped result its deviation from the sampled
mean in multiples of standard deviations. We find that 6 unmapped
alignments are 2 or more standard deviations worse than the mapped
alignments, whilst only 1 alignment is conversely better (these are marked
in Figure 5.13). Thus the mapping improves more alignments
than it degrades, but the number is small compared to the total (56).
because we cannot
repeat the results with unmapped data. Hence the test cannot be performed.
Instead, we can only ask if the single observation of the alignment shift
for unmapped sequences A and B is likely to be part of the distribution of
alignment shifts for the mapping replicates. Assuming a normal
distribution of mapped results for each pair of domains
(Figure 5.13 shows that this assumption is wrong in many
cases), we calculate for the unmapped result its deviation from the sampled
mean in multiples of standard deviations. We find that 6 unmapped
alignments are 2 or more standard deviations worse than the mapped
alignments, whilst only 1 alignment is conversely better (these are marked
in Figure 5.13). Thus the mapping improves more alignments
than it degrades, but the number is small compared to the total (56).
Extrapolating from this result, we suggest that only a handful of alignments of other fold topologies will also be improved. The increase in alignment accuracy shown in Figure 5.12(a) is the result of the balance between a small number of successful mappings and an even smaller number of unsuccessful mappings.